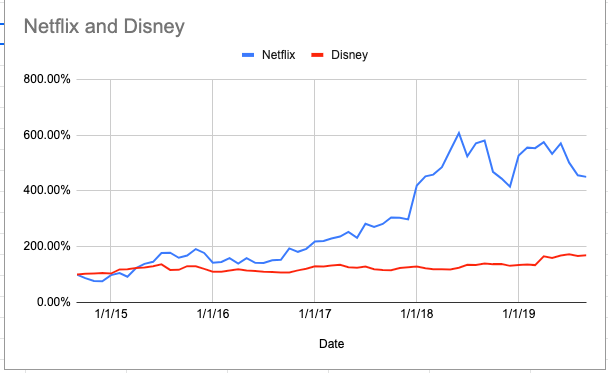
Stock Showdown QoD: Which company has performed better over the past five years, Netflix (NFLX) or Disney (DIS)?
Answer: Netflix
Netflix, at a recent price of $290/share, has increased 450% in the past five years ago, while Disney, at a recent price of $140/share, is up 169% compared to five years ago.

Questions:
- Both companies are in the business of entertaining, but have taken different approaches. How would you sum up each company in ONE sentence?
- What factors do you think contribute to the very different market performance of these companies?
- When you look for entertainment, which of these providers do you use more often? Have your preferences changed over the past year or two?
- Which company’s stock do you think will perform better in the next five years?
Behind the numbers: (Yahoo Finance)
According to this article, the tables may be about to turn for these two companies:
- The recent announcement by the Walt Disney Co. (NYSE:DIS) that it will bundle its three streaming services, Disney+, Hulu and ESPN+, into a single subscription was met with market enthusiasm.
- Consumers have been abandoning expensive cable packages in increasing numbers, a phenomenon driven in large part by the rise of streaming.
- The disruptor becomes the disrupted: Few would deny that Netflix Inc. (NASDAQ:NFLX) started the streaming revolution.
- A Netflix subscription once garnered access to most of the content that was worth watching (or binging, anyway). Now, with Disney already abandoning the website and others following suit, Netflix's value proposition has started to deteriorate rapidly. Disney, meanwhile, is only beginning to experience the tailwind associated with a paradigm shift.
- Disney rises above: Bundling presents strong opportunities for companies with substantial financial or intellectual property-based resources (and doubly so for companies with both), which seems tailor-made for Disney.
**Want to try this at home?
- Pull historical stock information from Yahoo Finance for 5 years for each company and drop in Google sheet.
- Using the Adj. Close column (which accounts for dividends), index the first day in the series to 100. How? Divide each of the adj. stock prices by that first's day stock price.
- Then arrange three columns with one being date, second being AT&T stock prices indexed to first day in the series and the third for Verizon's indexed stock prices.
- Highlight those three fields, and Insert>Chart and voila you have the stock comparison chart you see above.
----------------------
Bring investing to life with STAX, our investing game where students make 20 years of investing decisions in 20 minutes!
About the Author
SEARCH FOR CONTENT
Subscribe to the blog
Get Question of the Day, FinCap Friday, and the latest updates from NGPF in your inbox by subscribing today:
MOST POPULAR POSTS


